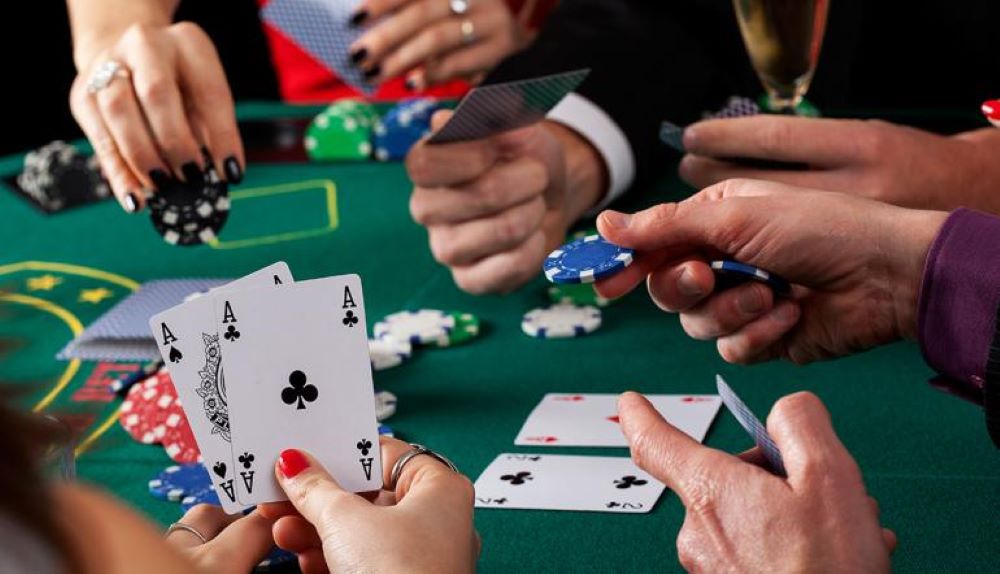
Anyone who has started training in poker will have noticed that there are concepts that hide an immense level of complexity. That complexity comes because behind some moves or moves there is a whole calculation behind. It is not for nothing that poker is considered a mental sport, and mathematics and the calculation of probabilities in real time are the order of the day.
Poker charts are an indispensable element to progress, since they include the results of these complex calculations so that you can make the right move depending on the circumstances. The charts are nothing more than graphs that analyze certain parameters to help you make the best decision at all times; therefore, playing without a chart is too risky: even being very skilled in mental calculation you could fail because of nerves or haste, a problem that disappears with the charts.
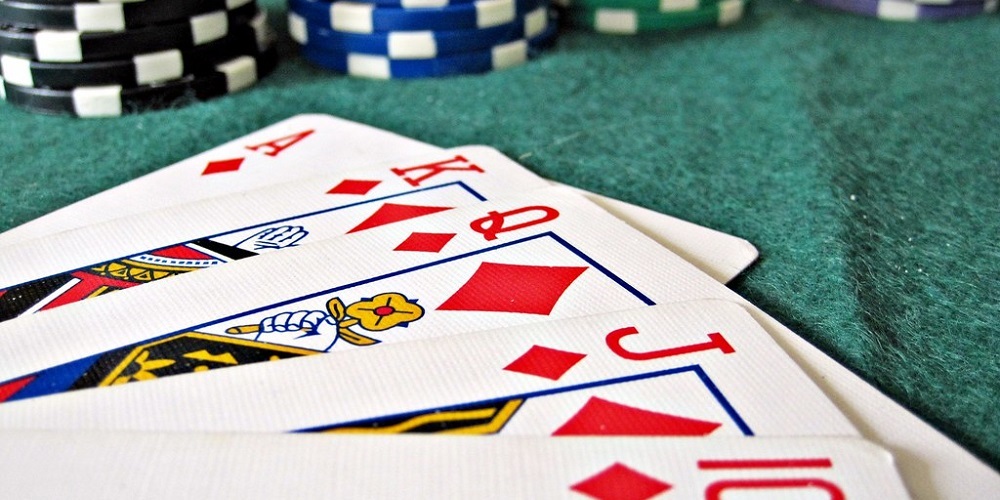
Poker Hands Chart
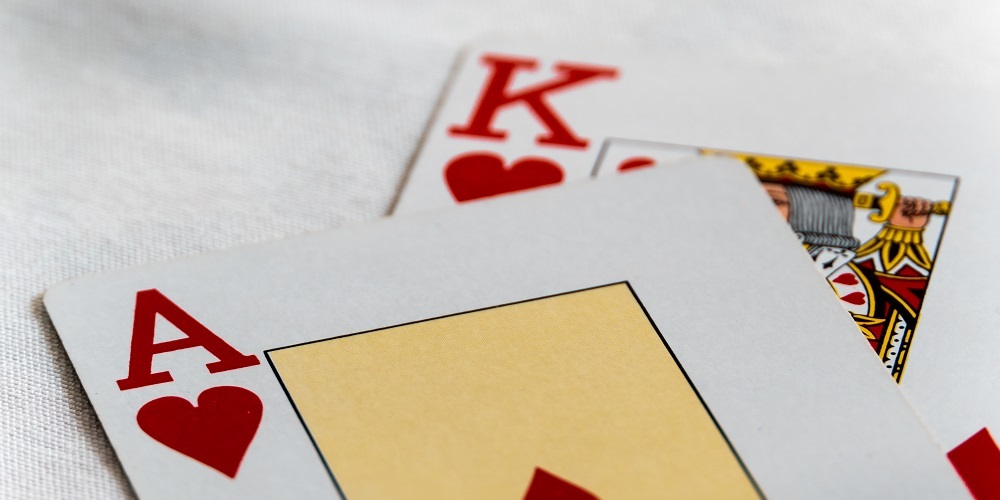
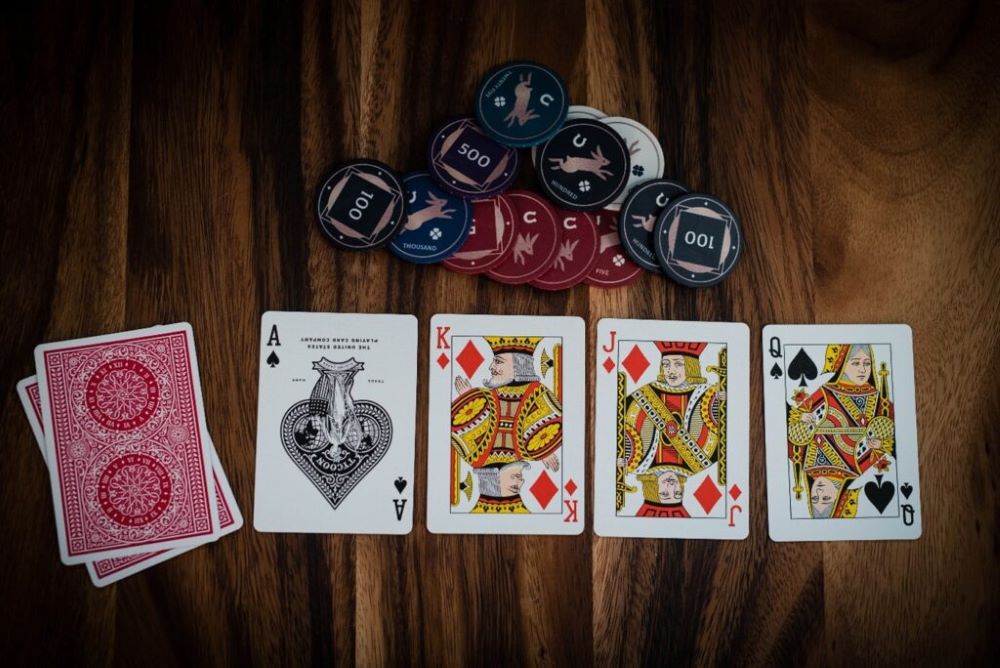
Poker hands charts are charts on which the player can consult the 10 best starting hands in a Texas Hold’em game. We are talking about starting hands, not the best hands in general. It is good to consult it because it includes all the information about the hands with which you will have more chances of winning depending on the situation of the game.
In decreasing order, the best starting hands are:
- Pair of aces: A♣ A♥
- Pair of kings: Kª K♦
- Pair of queens: Q♥ Qª
- Ace and king of the same suit: A♦ K♦
- Pair of jacks: J♥ Jª
- Pair of tens: 10ª 10♣
- Ace and king of a different suit: A♦ K♥
- Ace and queen of the same suit: Aª Qª
- Ace and Jack of the same suit: A♣ J♣
- King and queen of the same suit: K♥ Q♥
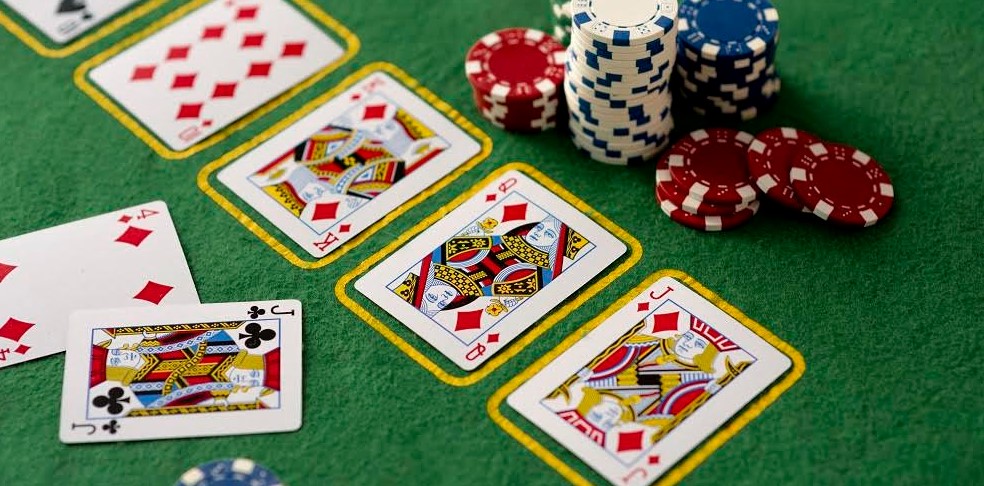
Poker Odds Chart
Odds calculation is essential in poker, as poker charts are. A good way to have the data of your odds is to reflect the results in a poker odds chart to have an overview of your chances.
Not all hands offer you the same chances of winning. That is basic, but quantifying what probability each one offers is what can really help you to know what real possibilities you have.
Although you are not obliged to memorize all the charts or the data in each of the cells, it is highly recommended that you try to retain the information in the chart to speed up your queries.
In essence, to calculate the odds of a hand in poker you have to know the relationship between the outs and the cards that remain to be dealt. If we want to know what the odds are on two hands, we can use a mathematical formula:
Probability of the Turn + Probability of the River – Product of 2 probabilities
| OUTS | HAND | TURN / RIVER | ONLY TURN | ONLY RIVER |
| 1 | – | 4,25% | 2,13% | 2,17% |
| 2 | From pair to three of a kind | 8,42% | 4,26% | 4,35% |
| 3 | From high card to pair | 12,49% | 6,38% | 6,52% |
| 4 | From straight to gutshot | 16,47% | 8,51% | 8,70% |
| 5 | From pair to two pair | 20,35% | 10,64% | 10,87% |
GTO Poker Chart

GTO poker strategy is a style of play based on perfection, or the attempt to follow an optimal style of play. It comes from the acronym Game Theory Optimal, and the chart reflects what is the perfect play in each of the assumptions of a game.
There are several kinds of poker charts to consult the optimal theory depending on the variant of poker being played, your position at the table, what your cards are, and what your opponent is playing. So, why not consulting a GTO poker chart in order to know what’s the optimal strategy?
These charts are almost impossible to memorize, since it would mean to retain in your mind each of the possible moves, something impractical. The result of these charts can be calculated with a help program, which calculates what is the perfect theoretical play according to the data you enter or the aspects it analyzes.
You are probably wondering if the charts are really useful considering that the game can change so much. Yes, they are, considering that the charts are merely query tools. But GTO charts are not good for memorizing assumptions, rather they should be used as an occasional support when the game presents a situation that you do not know how to deal with.
Poker Position Chart
Another point to keep in mind is the way in which the position is called depending on where you are at the chart with respect to the button.
A poker position chart usually includes data in a more graphical way, but in essence the set of data that they bring together is the following:
- BB. The big blind. It is placed immediately to the left of the small blind.
- SB. The small blind. Placed just to the left of the button.
- BTN. The button or dealer.
- CO. Cutoff. It is the player placed to the right of the button.
- HJ. The hijack is placed to the right of the cutoff.
- UTG. The player placed in the Under The Gun position is the one who speaks first.
- UTG +1. Also called EP2, it is placed just to the left of the UTG.
- UTG +2. Also called EP3, it is two places to the left of the UTG.
- UTG +3. Also called MP1 (Mid-Position 1), it is placed three places to the left of the UTG.
- UTG +4. Mid-position 2 is four places to the left of the UTG.
Poker Value Chart
Expected Value (EV) is the total amount of chips that we should win or lose in a specific situation in a poker game. It is a value that can be calculated with a mathematical formula:
EV = (%A x €A) – (%B x €B)
Where:
- %A is the frequency with which we win the hand.
- €A is the amount we get when we win.
- %B is the frequency with which we lose the hand.
- €B is the amount we lose when we lose the hand.
Note that the EV calculation makes more sense when used as a comparison tool. By itself, EV is not representative of anything. Instead, by comparing what the EV of one play is with respect to the EV of another, we can make a decision about which hand to play or which play to make.
The thing to keep in mind is that, in the long run, if the EV is positive, it will bring us profit; if it is negative, the play will lose us money. That is why a poker value chart is so useful to have the EV results at hand: it allows us to consult which play is more beneficial in the long-term depending on the circumstances of the game.
Poker Hand Equity Chart
The equity is the part of the pot that belongs to us at a specific moment of the hand. It is a variable that allows us to know what is the percentage of times we are going to win the pot in a certain context. To reflect all these variables and obtain the exact percentage quickly, there is nothing better than a chart to organize all this information.
Equity can be calculated at different stages of the game, from preflop to river. Each poker hand equity chart will have a specific percentage depending on your position at the chart and the variables at each moment, so the charts are a good tool to know what are the chances of getting the pot in each phase of the game.